
 Facebook
 X
X
 Pinterest
 Copy Link
Cape Breton Real Estate Market Report 2025: Seasonal Trends Define Year’s Performance
The Cape Breton real estate market in 2025 demonstrated classic seasonal patterns with distinct buyer and seller windows throughout the year. While overall property values remained relatively stable with a year-end return on investment of -1.6%, market activity and pricing showed significant seasonal variations that both buyers and sellers should understand when planning their real estate moves.
Market Speed: Properties Moved Fastest in Summer
Days on market told an interesting story throughout 2025, revealing when buyers were most active and competitive.
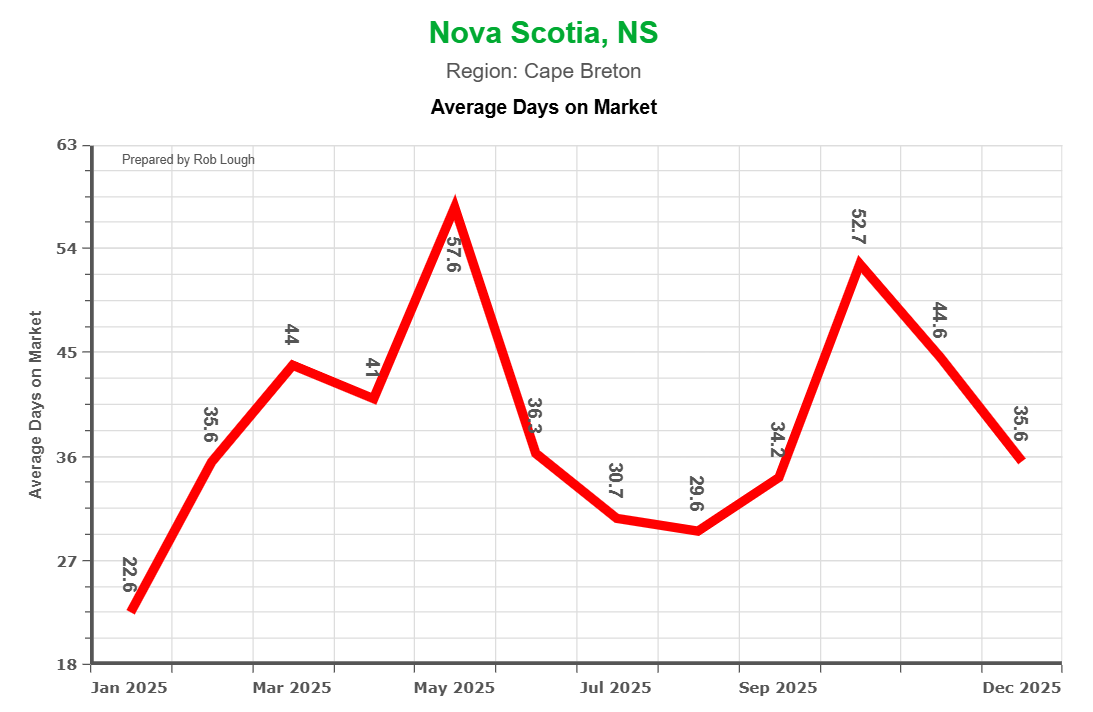
The year started relatively brisk with properties averaging just 23 days on market in January. However, market speed slowed considerably heading into late spring, with listings lingering for nearly two months by May at approximately 58 days on market. This spring slowdown created opportunities for buyers willing to negotiate, as sellers became more motivated with longer listing periods.
The fastest market conditions emerged during midsummer, when serious buyers cleared quality inventory quickly. July and August saw days on market drop to roughly 30 days, representing the most competitive period for buyers throughout the year. Properties listed during this window typically received offers more than twice as fast as spring listings.
Market speed slowed again heading into fall, with October seeing another peak around 53 days on market before easing slightly by December to the mid-30s range. This fall slowdown provided a second opportunity window for buyers seeking more negotiating leverage.
Pricing Trends: Summer Peak with Stable Year-End Values
Average sale prices in Cape Breton displayed moderate volatility throughout 2025, with a clear summer peak standing out.
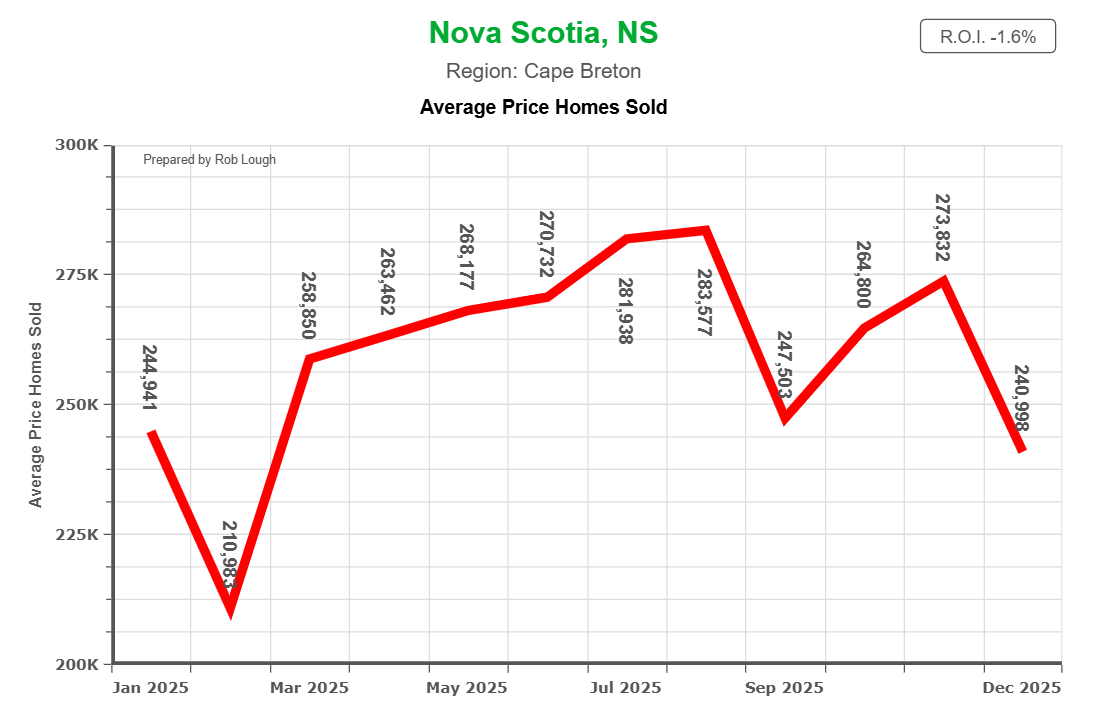
The year began in the mid-$240,000 range before dipping to approximately $211,000 in February, representing the lowest point of the year. From this winter low, prices climbed steadily through spring and early summer, reaching a peak of around $284,000 in August—a gain of roughly $73,000 from the February trough.
Following the August high, prices retreated into the mid-$240,000s in September before recovering somewhat into the low-$270,000s by November. The year closed with prices around $241,000 in December, resulting in a full-year ROI of approximately -1.6%.
The pricing pattern reveals that while Cape Breton properties experienced seasonal fluctuations, overall values remained relatively stable rather than experiencing dramatic growth or decline. The summer peak represented optimal selling conditions, while the winter and late fall periods offered better value for buyers.
Sales Volume: Strong Summer Demand Defined Market Activity
Unit sales demonstrated the market’s pronounced seasonal nature, with demand concentrated heavily in the warmer months.
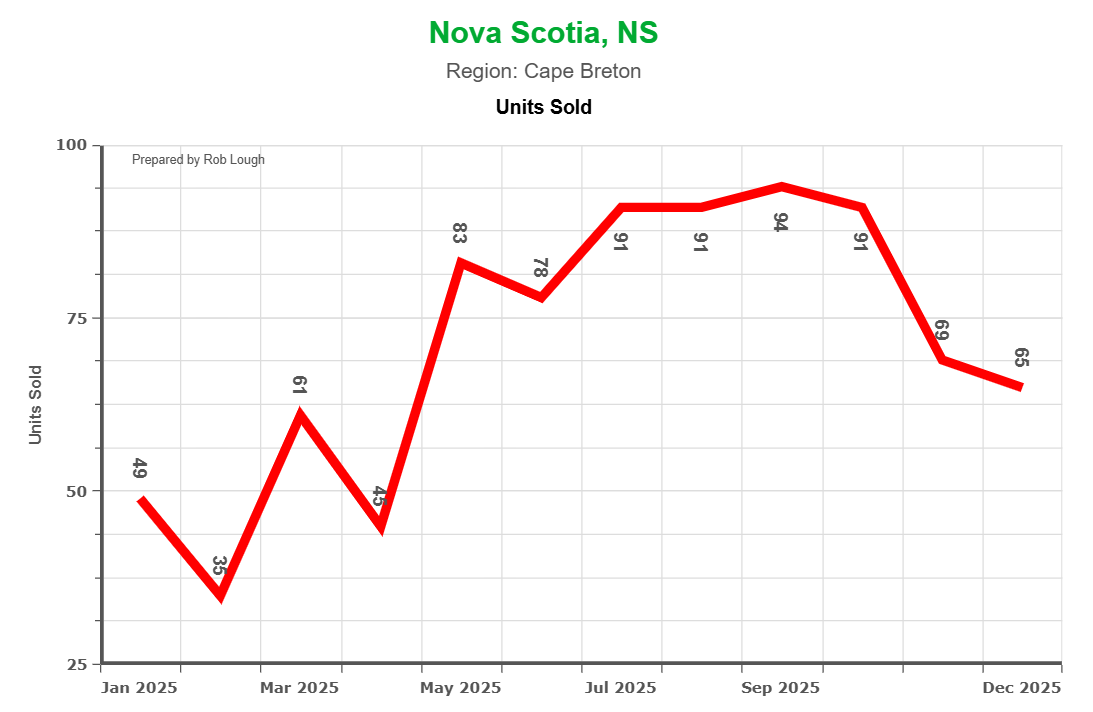
Cape Breton Market Stats 2025 number of Units So
Winter sales volume remained modest with approximately 49 units sold in January and dropping to just 33 units in February, the year’s lowest point. As spring arrived, activity accelerated significantly, jumping into the 80s by May and maintaining momentum through the prime summer season.
The peak selling period ran from July through September, with sales volume reaching the low-90s during these months. This represented nearly triple the activity level seen during the winter months, demonstrating the market’s strong seasonal preference.
After September, unit sales declined but remained respectable, falling back into the 60s for November and mid-60s by December. While below peak levels, late-year activity still exceeded winter lows, suggesting year-round market functionality with clear seasonal intensity variations.
Negotiating Power: Tight Ratios Favored Sellers Throughout
The sold-to-ask ratio remained remarkably consistent throughout 2025, indicating sustained seller leverage across most market conditions.
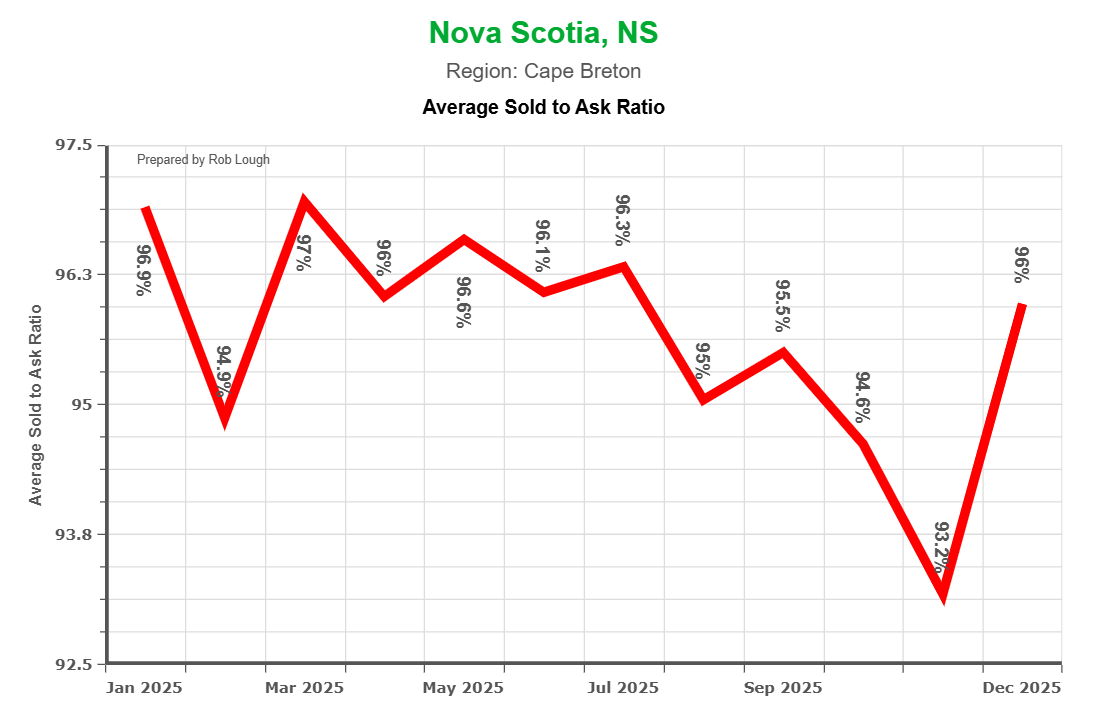
Throughout the year, the ratio oscillated between approximately 93% and 97%, with properties consistently selling within 3-7% of their asking prices. The strongest seller conditions appeared around January through March and again in mid-year, when ratios approached or exceeded 96%.
The most favorable negotiating conditions for buyers emerged in fall, particularly November, when the ratio bottomed near 93%. This represented the widest discount window of the year, though even at this low point, sellers maintained substantial pricing power compared to markets experiencing buyer dominance.
By December, the ratio had rebounded to approximately 96%, demonstrating that even in slower seasonal periods, Cape Breton sellers retained considerable negotiating leverage. For buyers, the data suggests that while some discount from asking price is standard practice, significant below-list purchases remain challenging regardless of season.
Total Market Volume: Economic Activity Concentrated in Summer
The total dollar value of sales transactions revealed where the market’s economic weight was concentrated throughout the year.
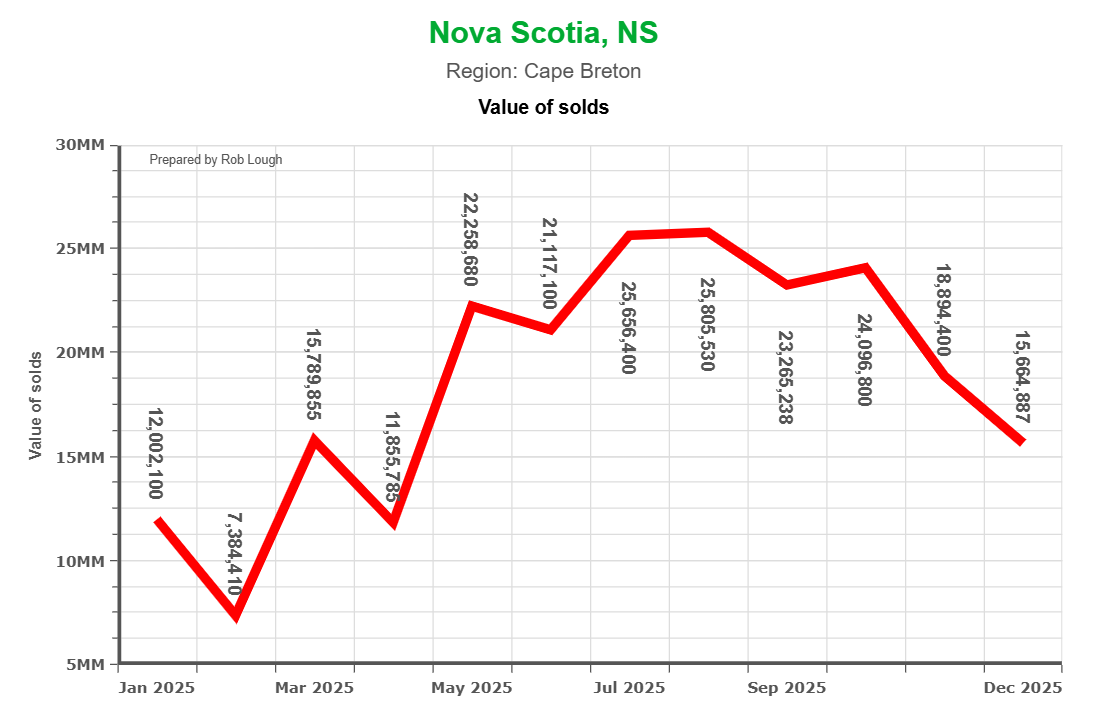
Cape Breton Market Stats 2025 Value of Solds
Monthly dollar volume started around $12 million in January before dipping to approximately $7-8 million in February, the year’s low point. Volume accelerated dramatically heading into late spring, exceeding $22 million by May and peaking above $25-26 million during July and August.
This summer peak represented the convergence of both higher unit sales and higher average prices, creating the year’s most economically significant selling period. The market remained strong through early fall with dollar volumes in the low-mid $20 million range before declining to the mid-teens by December.
Even at the December level of approximately $15 million, monthly volume remained roughly double February’s trough, indicating that while the market cooled seasonally, it maintained functionality throughout the year. The total annual transaction volume demonstrates that Cape Breton’s real estate economy depends heavily on the May through September period for the majority of its activity.
Combined Price and Volume Analysis
The relationship between pricing and sales volume revealed important market dynamics.
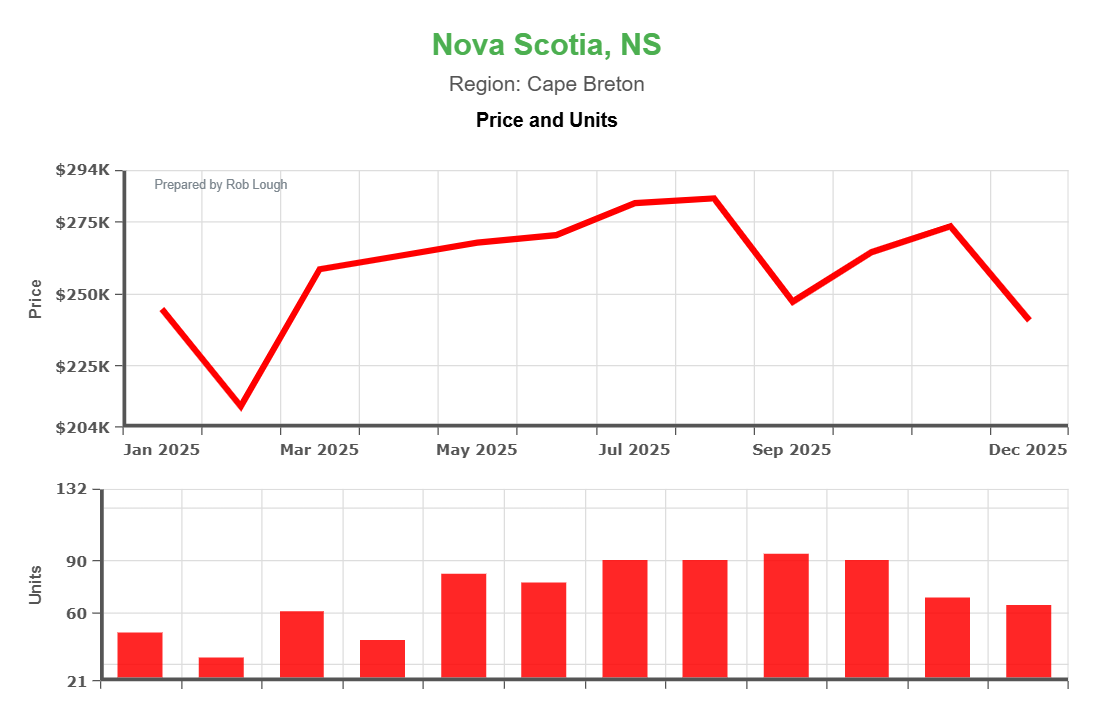
The dual trend chart showed prices and units rising broadly together into summer, confirming that higher demand was associated with higher prices rather than discount-driven volume. This pattern indicates a healthy market where increased buyer activity competed for available inventory, supporting price appreciation during peak periods.
As unit sales fell in autumn and winter, prices pulled back but not proportionally, suggesting underlying price support even as market activity cooled. This price resilience during low-volume periods indicates that Cape Breton property values maintain stability independent of transaction frequency, a positive indicator for long-term value retention.
What This Means for Buyers
Best buying windows: Late fall (October-November) and late winter (February) offered the most favorable conditions for buyers in 2025. During these periods, longer days on market, lower prices, and slightly better negotiating ratios created relative buyer advantages.
Competitive periods: Summer months, particularly July and August, represented the most challenging conditions for buyers. Properties moved quickly, prices peaked, and seller leverage was strongest during this window.
Pricing strategy: Buyers should expect to pay within 3-7% below asking price regardless of season, but fall purchases may yield an additional 10-15% price advantage compared to summer highs based on 2025 patterns.
Market timing: Buyers seeking maximum selection should engage in late spring as inventory builds, while those prioritizing value should focus on late fall and winter opportunities when seller motivation increases with longer market times.
What This Means for Sellers
Optimal listing windows: Late spring through summer (May-August) provided the best conditions for sellers in 2025, with the fastest sales, highest prices, and strongest negotiating positions all converging during this period.
Pricing expectations: Properties listed during peak summer months commanded premiums of $30,000-$40,000 compared to winter listings, while moving twice as fast.
Market realities: Even during slower periods, sellers maintained solid leverage with sold-to-ask ratios rarely dropping below 93%. This suggests that properly priced Cape Breton properties find buyers year-round, though timing impacts both speed and price optimization.
Strategic considerations: Sellers unable to list during the prime May-August window should consider early fall (September) as a secondary option, when residual summer momentum often persists before the late-fall slowdown.
Looking Ahead
Cape Breton’s 2025 market demonstrated textbook seasonal real estate patterns with clear buyer and seller windows throughout the year. The market maintained functionality across all seasons while showing pronounced advantages for strategic timing.
For 2026, buyers and sellers should anticipate similar seasonal patterns unless significant economic or demographic changes alter the fundamental supply-demand dynamics that drove 2025’s performance. The relative price stability despite seasonal volatility suggests a market in reasonable balance, with neither chronic oversupply nor severe shortage conditions dominating the landscape.
Understanding these seasonal trends allows both buyers and sellers to make more informed decisions about when to enter the Cape Breton real estate market, potentially capturing thousands of dollars in value through strategic timing.

